Note to reader: Over the next several weeks, Heartland Forward will be analyzing the types of businesses and races of business owners that received PPP loans through June 30, 2020.
It is worth noting at the outset that an overwhelming majority of applications did not identify race or ethnicity. In the Heartland1, the non-response rate to the race or ethnicity questions reporting varies by state, ranging from 68 percent in North Dakota to 92 percent in Tennessee. Given the limited number of responses, we aggregate and report the data at the state level.
You can preview the visualizations referenced below here:
(For mobile viewers, we recommend landscape orientation.)
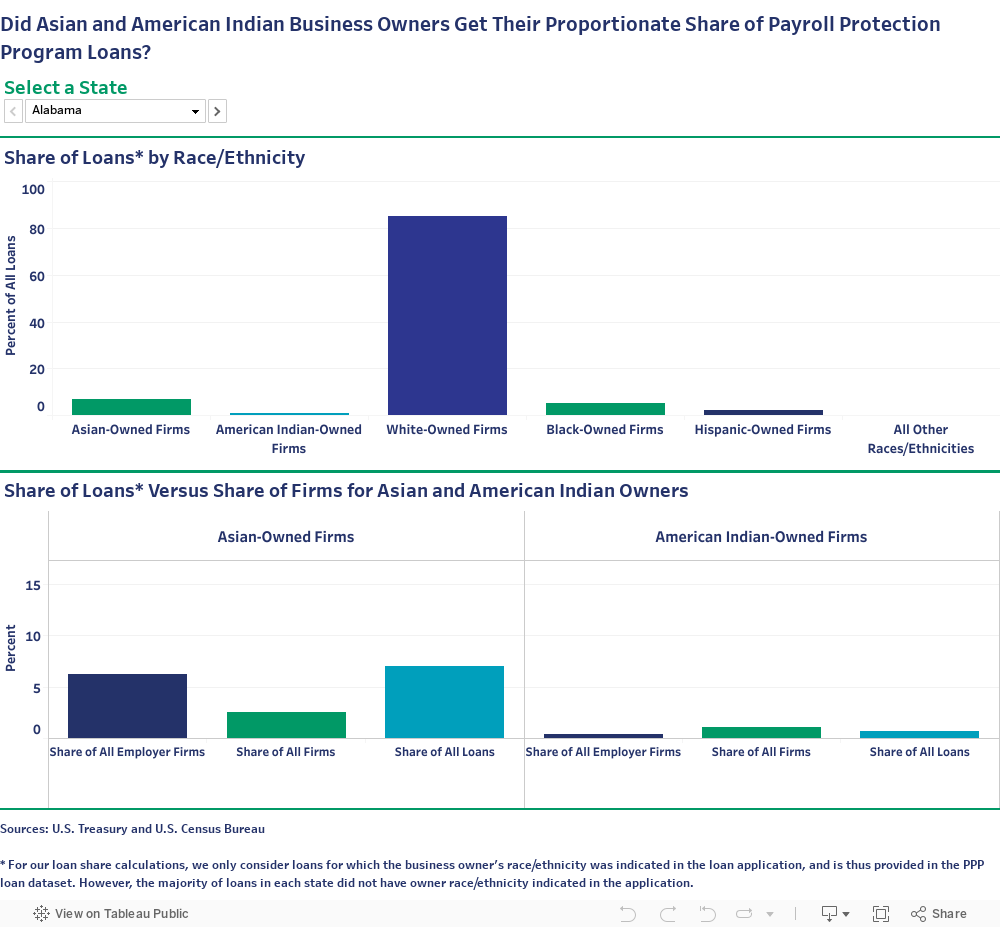
Exploring the Share of Loans by Race/Ethnicity chart, one can quickly observe that white-owned businesses dominate the PPP loan portfolio in every state in the Heartland. (NOTE: You can view any state in the Heartland by selecting it from the drop-down menu.) In all but six states in the Heartland, Asian-owned businesses represent the second largest share of loan recipients. In Kansas, Nebraska and Texas, Asian-owned businesses were the third largest share of loans after white- and Hispanic-owned businesses. Asian-owned businesses were the third largest share, behind white- and Black-owned businesses, in Louisiana and Mississippi. Asians were there fourth largest share of loans in North Dakota.
The number of minority-owned businesses vary in each state, so we provide two measures to compare the share of PPP loans to either Asian- or American Indian-owned businesses:
• the share of all employer firms that are Asian- or American Indian-owned (probably the closest number to the population of businesses applying for PPP), or
• the share of all firms (including self-employed and non-employer firms) that are Asian- or American Indian-owned.
The first two columns in each side of the chart represent the benchmark values: share of employer firms and share of all firms, respectively. The third column presents the share of loans going to either Asian- or American Indian-owned businesses. If this right-most column is higher than those to the left, then this indicates that the minority group received a greater share of loans than one would expect based on the group’s share of firms.
Several observations:
• Relative to businesses owned by all other races/ethnic groups, Asian-owned businesses are more likely to be employer firms in every state in the Heartland – note that Asian-owned businesses make up a higher share of employer firms than all firms.
• Relative to businesses owned by all other races/ethnic groups, American Indian-owned businesses are more likely to be non-employer
firms in every state in the Heartland.
• Asian-owned businesses received a greater share of PPP loans than their share of employer firms in these 11 states: Alabama, Illinois, Indiana, Kentucky, Louisiana, Michigan, Oklahoma, South Dakota, Tennessee, Texas and Wisconsin.
• In Minnesota, Nebraska and North Dakota, Asian-owned businesses received fewer loans than expected when compared to all Asian-owned businesses in each state.
• In Iowa, Kansas, Nebraska, and Oklahoma, American Indian-owned businesses received fewer loans than expected when compared to all American Indian-owned employer firms.
• American Indian-owned firms did not receive a greater share of PPP loans than their share of all firms in any state in the Heartland.
• North Dakota was the only state in which American Indian-owned firms received a greater share of PPP loans than Asian-owned firms.
Payroll Protection Program (PPP) represents a unique stimulus program designed to encourage businesses to maintain payroll levels despite pandemic-related interruptions by authorizing local financial institutions to extend potentially forgivable loans at favorable terms. The program provided one-percent loans to qualifying businesses, though the loan would be forgiven if certain requirements were met by the business.2
While designed for expediency, the PPP sought to leverage existing financial institutions to distribute the loans rather than create tedious qualification rules and bureaucracy, which would have required both time and resources. However, expediency is not without cost – specifically, leveraging existing financial institutions may limit access to the PPP for minority business owners.
First, some minorities are grossly un- or underbanked. Forty-five percent of American Indian households are considered under- or un-banked. Meanwhile, only 20 percent of Asian households are underbanked, a share that is much more in line with that of white households.3 Without prior relationships with a banking institution, American Indian business owners may not have had adequate access to PPP funding, which likely contributed to low shares of loans relative to their shares of all firms in each Heartland state.
Also, businesses owned by certain minorities tend to be small and, overwhelmingly, do not have employees. National data suggests that American Indian-owned businesses are 7.22 times more likely to be non-employer businesses than employer firms; white business owners are only 2.6 times more likely.4 Asian-owned businesses, however, are only 1.96 times more likely to be non-employer businesses than employer firms. While being a non-employer firm does not prohibit participation in PPP, nor does it preclude loan forgiveness (under the current guidance), these businesses typically do not have access to accountants, lawyers and/or suitable records to assist with the loan application and to validate the terms of loan forgiveness (e.g., 60 or 75 percent of funds allocated to labor payments).
So, what does this all mean? In short, it means that the Heartland’s Asian-owned employer firms likely received their fair share of loans in most states. American Indian-owned firms likely did not receive their fair share of PPP loans, given their propensity to be non-employer firms. While we know the program created barriers to participation for minority business owners, we also know our country has been built on the “American Dream,” of which owning your own business — being an entrepreneur — is a part. And while entrepreneurship is not the single driver of our economy, it is an important one as noted in Heartland Forward’s previous report, “Young Firms and Regional Economic Growth.”5 Knowing this, we need to work collectively to remove the inequality of economic opportunity to help people sustain their businesses especially during such unprecedented times.
Below is the schedule of posts in this series:
• Week 1: Black and Hispanic Business Owners
• Week 2: American Indian, Pacific Islander and Asian owned businesses
• Week 3: Loan Recipients by Gender
• Week 4: Accommodations and Food Services & Arts, Entertainment, Recreation Businesses
• Week 5: Manufacturing
• Week 6: Retail & Other Services
Data Notes
Data on Payroll Protection Program loans are from the U.S. Treasury. These are loan-level data based on individual loan applications. We aggregated loan-level data to the state level in order to capture the state-level distribution of loans across races and ethnicities.
Data on owners of employer firms are from the U.S. Census Bureau’s 2017 Annual Business Survey.
Data on owners of all firms (both employers and non-employers) are from the U.S. Census Bureau’s 2012 Survey of Business Owners. Use of these data are necessary due to the lack of publicly available information on non-employer firms from the 2017 Annual Business Survey.
In the Payroll Protection Program loan data, there is a single characteristic variable combining business owner race and ethnicity instead of separate race and ethnicity variables. Thus, owners are classified by the single race or ethnicity that they believe best describes them, as opposed to being able to indicate, for example, that they are Hispanic and Black. Applicants were given the option to select “Multi-Group” in their application, but the Heartland only had one approved loan where the applicant selected the option. Meanwhile, the Census Bureau’s survey data allowed respondents to choose both a race and an ethnicity. To overcome this incompatibility, we consider any respondents who selected Hispanic for their ethnicity to be Hispanic only, respondents who selected non-Hispanic for ethnicity and Black for race to be Black, and respondents who selected non-Hispanic for ethnicity and white for race to be white.
ENDNOTES
- The Heartland region consists of these states: Alabama, Arkansas, Illinois, Indiana, Iowa, Kansas, Kentucky, Louisiana, Michigan, Minnesota, Mississippi, Missouri, Nebraska, North Dakota, Ohio, Oklahoma, South Dakota, Tennessee, Texas and Wisconsin.
- Complete details about the SBA’s Payroll Protection Program, including qualifying businesses and loan forgiveness criteria, can be found here: https://www.sba.gov/funding-programs/loans/coronavirus-relief-options/paycheck-protection-program.
- Calculations made by the author using Federal Deposit Insurance Corporation’s 2017 National Survey of Unbanked and Underbanked Households. Available at https://www.economicinclusion.gov. Unbanked households have no accounts at an insured financial institution, while underbanked households have a savings or checking account but solicit alternative financial services (e.g., check-cashing firm or payday lender) for other transactions.
- In 2012, based upon the Census Bureau’s Survey of Business Owners, Asians and American Indians nationally were 1.96 and 7.22 times, respectively, more likely to own firms without employees than firms with employees. White business owners were only 2.96 times more likely.
- Crews, J., DeVol, R., Florida, R., and Shideler, D. (May, 2020). “Young Firms and Regional Economic Growth: Knowledge-Intensive Entrepreneurs Critical.” Bentonville, AR: Heartland Forward. Available here: https://heartlandforward.org/media/pages/young-firms-and-regional-economic-growth/2863128872-1588779952/young-firms_full-report-launch.pdf