This is the second in a series of posts comparing the economic consequences of COVID-19 in the Heartland.
The statistics presented here come from the first and second waves of the Household Pulse Survey, which collected information from adults aged 18 – 88 living in the U.S. from April 23 – October 20, 2020.
During the surveys, more than 1.2 million people representing all 50 states were surveyed. The data were downloaded from https://www.census.gov/programs-surveys/household-pulse-survey/data.html.
This year will live vividly in our collective memories for decades to come. I fully anticipate our grandkids (and great-grandkids) will mock our repeated stories of heartaches and headaches that have come from the losses and uncertainty we have faced this year. There are the obvious losses of life, long-term health battles, businesses that will not come back from the temporary shutdowns and lost sense of community—the milestones not celebrated or grieved together as we try to protect each other from the virus. The protests over social issues and divisive politics have further contributed to the emotional toll 2020 has inflicted upon us all.
While the losses of lives and livelihoods have gotten more attention, the emotional and mental health effects of the pandemic also have been acknowledged and discussed 1 2 3
The Census Bureau included mental health questions in the Household Pulse Survey (HPS) to track how families across the country are faring. This analysis will explore the responses about being bothered by potential mental health concerns.
Definition of bothered : feeling or showing agitation, worry, annoyance, etc.`
The questions considered in this analysis ask:
“Over the last seven days, how often have you been bothered by the following problems:
• Feeling nervous, anxious, or on edge?
• Not being able to stop or control worrying?
• Having little interest or pleasure in doing things?
• Feeling down, depressed or hopeless?”
For each scenario, there are four possible answer choices:
• Not at all
• Several days
• More than half the days
• Nearly every day.
(The responses “Several days,” “More than half the days,” and “Nearly every day” are referred to as “being bothered” in the discussion that follows.)
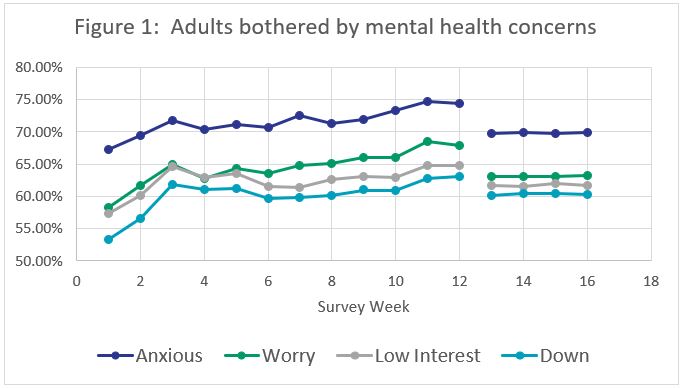
There are some distinct patterns in the mental health responses in Figure 1, showing the percentage of adults with concerns each week of the surveys. It is noteworthy that the lower limit on this graph is 50 percent, indicating the majority of adults report being bothered every week of the survey:
• There are also clear patterns in what is bothering us.
• Anxiety or being anxious is most frequently reported as a concern.
• **Feeling down, depressed, or hopeless is consistently the least frequently reported concern.
**
There is also a slight upward trend for weeks one through–12. Those weeks are from Phase 1 of the (link: https://www.census.gov/programs-surveys/household-pulse-survey/data.html text: HPS), which represents data collected from April 23 to July 21, 2020. Weeks 13 to 16 are from Phase 2 which began on August 19.1
Dr. Paula Graham, a psychiatrist with the Veteran’s Administration, is not surprised to see this pattern. Graham has seen an increase in the number of patients with mental health problems and the severity for those who have struggled even before the pandemic. She explains the steep rise in the early weeks of Phase 1 percentages were due to“fear, and complete uncertainty with closures, finance, etc. ”The slight increases the next several weeks reflect “fatigue of not having socialization or normal activities.” The lower, flatter pattern (weeks 13-16) represent Phase 2 of the survey that began in August; it may reflect lower stress levels from schools resuming and other business and activities opening back up.
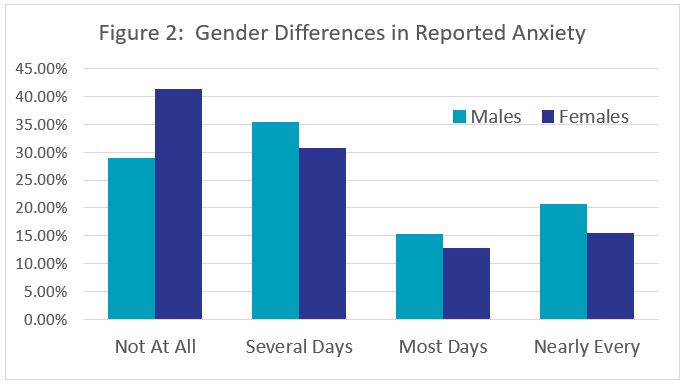
We also see patterns by gender. ** Figure 2** shows the differences in males and females’ responses when asked about being bothered by anxiety in the past week. Women are statistically more likely to report not being bothered at all, while males are more likely to report being bothered. While this graph only shows responses for anxiety, the pattern is consistent for all four questions.
These gender patterns persist when we look at just the Heartland(super:4) region. Figure 3 summarizes the percentage of adults who reported concerns on each question in the survey.
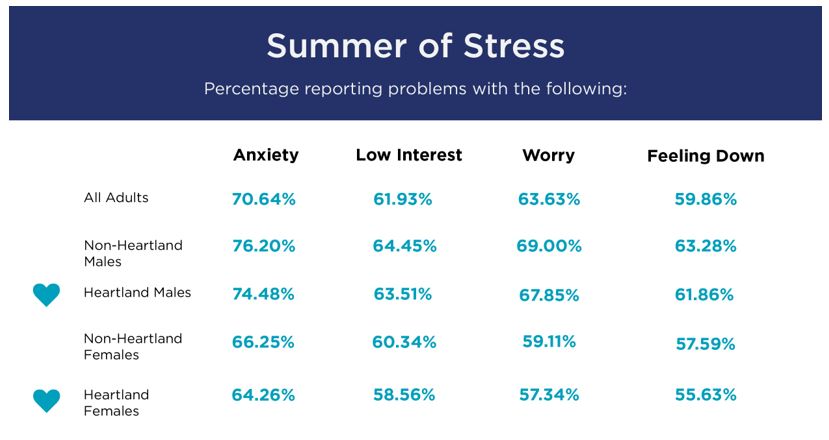
This figure breaks out responses by males and females in the Heartland and non-Heartland regions. Across all four questions, males are more likely than females to report problems and non-Heartlanders are more likely than Heartlanders to report concerns. Graham was a bit surprised that females were less likely to report concerns given the childcare and employment challenges so many have faced, but she was not surprised by the lower rates of Heartlanders. Life in the Heartland may feel less interrupted since the Heartland has enacted fewer restrictions on average.(super:5)
A couple of items to note when it comes to analyzing responses to the HPS:
- These are self-reported responses to survey questions and not mental illness diagnoses. Data from KFF.org collected in 2017-2018 and additional data collected this summer specifically to evaluate the pandemic show no differences in the rate of mental illness between Heartland and non-Heartland states. The differences in survey responses without corresponding differences in actual diagnoses suggest Heartlanders may perceive the events of 2020 to be less concerning than non-Heartlanders.
- While this article has explored differences to point out interesting phenomena and see what can be learned from the data, the effects of 2020 are monumental across the map for every person. No one is getting through 2020 without a scratch.
If you are one of the millions bothered by worry, anxiety, or feeling down right now, you may find some good ideas to help you and your loved ones feel connected until we can resume meeting in person with all of our favorite people.
National Alliance on Mental Illness
Substance Abuse and Mental Health Services Administration
Mental Health America–Tips
Boost Your Wellbeing and Resiliency
APA Self-Care Resource Center
One-hundred self-care ideas
Ways to Help Children Cope
National Suicide Prevention Lifeline 800-273-8255
ENDNOTES
- https://www.kff.org/coronavirus-covid-19/issue-brief/the-implications-of-covid-19-for-mental-health-and-substance-use/
- https://www.nejm.org/doi/full/10.1056/NEJMp2008017
- https://www.npr.org/sections/health-shots/2020/09/02/908551297/pandemics-emotional-hammer-hits-hard
- In the second phase of the HPS beginning in August, each week actually represents data collected over a 14 day time period. We continue to use the week label to be consistent with the HPS data.
- The Heartland region consists of 20 states including: Alabama, Arkansas, Illinois, Indiana, Iowa, Kansas, Kentucky, Louisiana, Michigan, Minnesota, Mississippi, Missouri, Nebraska, North Dakota, Ohio, Oklahoma, South Dakota, Tennessee, Texas and Wisconsin.
- https://wallethub.com/edu/states-coronavirus-restrictions/73818 According to the weighted measure they derive Heartland states are 59.2% open and non-Heartland states are 43.4% open.