Note to reader: Over the next several weeks, Heartland Forward will be analyzing the types of businesses and races of business owners that received Paycheck Protection Program (PPP) loans through June 30, 2020.
You can preview the visualizations referenced below here:
(For mobile viewers, we recommend landscape orientation.)
The two most impacted industries by the COVID-19 pandemic have been Accommodations and Food Service (AFS) and Arts, Entertainment and Recreation (AER). With travel restrictions in effect, the demand for lodging has plummeted. The demand for eating in restaurants has been also impacted by travel restrictions, but more importantly, it has been impacted by policies limiting service directly. Many states restrict customers to 50 percent or less of capacity at any given time, if the dining room is open.
Arguably, the Arts, Entertainment and Recreation (AER) industry has realized the largest impact from the pandemic, as nearly all events involving groups of people, such as concerts, plays and sporting events, have been cancelled. Even movie and theatrical production was halted due to social distancing regulations. Online performances, virtual tours and movies already produced but released directly to streaming services are strategies these firms have used to maintain contact with their audiences and stakeholders. Professional sports are experimenting with a variety of protocols to salvage their seasons, ranging from the NBA’s “bubble” in Florida to MLB’s allowing teams to play in their home stadiums with no spectators.
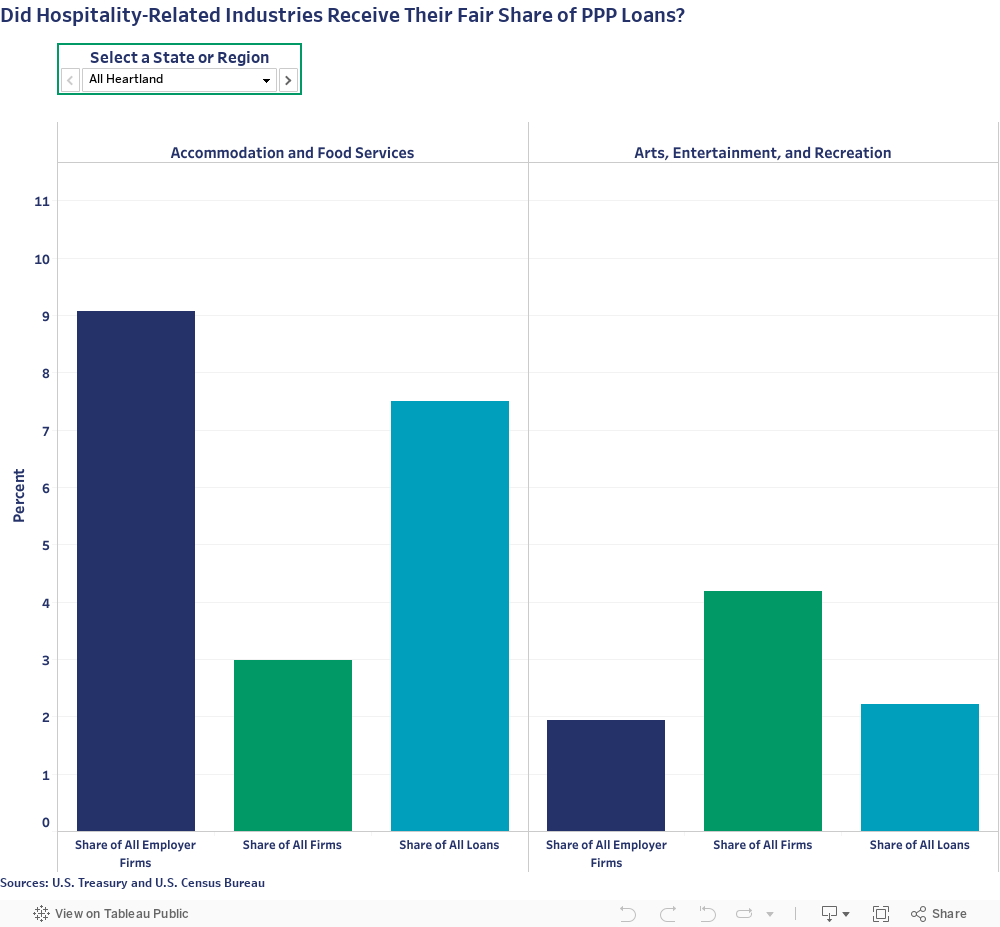
Exploring the share of loans by industry, one quickly observes that the AFS industry is dominated by employer firms, since AFS represents roughly nine percent of all employer firms but only three percent of all firms in the Heartland1. This is also intuitive, since most forms of lodging and food establishments require more than one employee to run efficiently. AER, on the other hand, appears to be dominated by non-employer firms, since the share of all firms in AER is 4.2 percent of Heartland businesses, while the share of employer firms in AER is only 1.9 percent.
The number of businesses in these industries vary in each state, so we compare the share of PPP loans to businesses in AFS and AER to the share of all employer firms in these industries (probably the closest number to the population of businesses applying for PPP), as well as the share of all firms in these industries (an estimate of the total population of businesses).
The first two columns in each side of the chart represents the benchmark values: share of employer firms and share of all firms (which includes non-employer firms such as sole proprietors, contract works and other self-employed individuals), respectively. The third column presents the share of loans going to either AFS or AER businesses. If this right-most column is higher than those to the left, then this indicates that the industry group received a greater share of loans than one would expect based on the group’s share of firms.
Several observations:
• For AFS businesses in the Heartland, the share of PPP loans is always less than the share of employer firms but greater than the share of all firms.
• Among Heartland states, Wisconsin has the largest share of all firms in AFS at 4.1 percent, the largest share of PPP loans to firms in AFS (9.0 percent), and the largest share of employer firms in AFS at 11.1 percent.
• Kentucky and Minnesota had the smallest share of all firms in AFS among the Heartland states, just 2.6 percent of all firms.
• Nebraska had the smallest share of PPP loans in AFS at 5.7 percent, while Minnesota has the smallest share of all employer firms in AFS at 7.5 percent.
• In most Heartland states, the share of loans in AER was greater than the share of all employer firms but less than the share of all firms.
• Iowa, Kansas, Nebraska, North Dakota and South Dakota all had a different pattern: the share of PPP loans was less than the share of all employer firms, which was less than the share of all firms.
• Minnesota and Mississippi realized a share of PPP loans roughly equal to that of the share of all employer firms but less than the share of all firms.
• The share of all employer firms in AER across the Heartland ranged from 1.5 percent (Oklahoma) to 2.7 percent in Tennessee, while the share of PPP loans in AER ranged from 1.6 percent (Mississippi) to 3.8 percent in Tennessee, and the share of all firms in AER ranged from 2.8 percent (Mississippi) to 5.9 percent (Minnesota).
Payroll Protection Program (PPP) represents a unique stimulus program designed to encourage businesses to maintain payroll levels despite pandemic-related interruptions by authorizing local financial institutions to extend potentially forgivable loans at favorable terms. The program provided one-percent loans to qualifying businesses, though the loan would be forgiven if certain requirements were met by the business.2
While designed for expediency, the PPP sought to leverage existing financial institutions to distribute the loans rather than create tedious qualification rules and bureaucracy, which would have required both time and resources. However, expediency is not without cost – specifically, leveraging existing financial institutions may limit access to the PPP for small and non-employer business owners.
So, what does all this mean? Businesses in the AFS industry may not have received their fair share of PPP loans, since the share of PPP loans was less than the share of all employer businesses. The share of loans did exceed the share of all businesses in each state, but this is largely because there are so few non-employer firms in AFS relative to their density in the rest of the economy – the PPP loan process is inherently more complicated for non-employer firms. Given how severely impacted AFS has been impacted by COVID-19, it is surprising that the industry’s share of PPP loans did not exceed the share of all employer businesses in any Heartland state.
For AER businesses, the situation was a bit different, but still reflects an unfair distribution; in general, Heartland states had a share of loans above the share of all employer firms, but well below the share of all firms. This reflects the unequal distribution of loans to non-employer firms, which AER is dominated by. As with AFS, one would have hoped that the severely impacted AER would have received a share of loans well above both its firm shares. However, the orientation of the loan program toward employer firms meant that did not happen for AER. While entrepreneurship is not the single driver of our economy, it is an important one as noted in Heartland Forward’s previous report, “Young Firms and Regional Economic Growth.”3 Knowing this, we need to work collectively to support and sustain businesses throughout the economy especially during such unprecedented times.
Congress and the Trump administration need to reach an agreement on extending economic and financial aid to those firms and individuals most impacted by COVID-19. Another round of PPP loans should be a major piece of the legislation as entrepreneurs are the main source of job creation across the Heartland, and time should be taken to consider how the loan program can be better oriented toward the non-employer firms that dominate AER and many other severely impacted industries. Businesses within the hospitality industries often personify and express a region’s culture and character, not to mention their embodiment of creativity. Successful economic development strategies leverage a region’s identity and encourage creativity which leads to innovation. The Heartland cannot afford to lose as single job that could be created by Hospitality industries.
Below is the schedule of posts in this series:
• Week 1: Black and Hispanic Business Owners
• Week 2: American Indian, Pacific Islander and Asian Owned Businesses
• Week 3: Loan Recipients by Gender
• Week 4: Accommodations and Food Services & Arts, Entertainment, Recreation Businesses
• Week 5: Manufacturing
• Week 6: Retail & Other Services
Data Notes
Data on Payroll Protection Program2 loans are from the U.S. Treasury. These are loan-level data based on individual loan applications. We aggregated loan-level data to the state level in order to capture the state-level distribution of loans across industries.
Data on industry of employer firms are from the U.S. Census Bureau’s 2017 Annual Business Survey.
Data on owners of all firms (both employers and nonemployers) are from the U.S. Census Bureau’s 2012 Survey of Business Owners. Use of these data are necessary due to the lack of publicly available information on nonemployer firms from the 2017 Annual Business Survey.
ENDNOTES
- The Heartland region consists of these states: Alabama, Arkansas, Illinois, Indiana, Iowa, Kansas, Kentucky, Louisiana, Michigan, Minnesota, Mississippi, Missouri, Nebraska, North Dakota, Ohio, Oklahoma, South Dakota, Tennessee, Texas and Wisconsin.
- Complete details about the SBA’s Payroll Protection Program, including qualifying businesses and loan forgiveness criteria, can be found here: https://www.sba.gov/funding-programs/loans/coronavirus-relief-options/paycheck-protection-program.
- Crews, J., DeVol, R., Florida, R., and Shideler, D. (May, 2020). “Young Firms and Regional Economic Growth: Knowledge-Intensive Entrepreneurs Critical.” Bentonville, AR: Heartland Forward. Available here: https://heartlandforward.org/media/pages/young-firms-and-regional-economic-growth/2863128872-1588779952/young-firms_full-report-launch.pdf