An analysis of the success gap between Black and white individuals, not only how it varies by region and ruralness of the childhood community, but also how the relationship between the success gap and ruralness varies by region.
It is well-established that, in the United States, the likelihood of a Black individual being economically successful is much lower than the likelihood for a white individual.[i] What is less understood is how this success gap varies geographically. What do you think? Would you expect the success gap to be wider (more unequal) for Black and white individuals who grew up in a rural, midwestern community or those who grew up in a northeastern city? Given what we have read and heard about the extent of racism in rural America, a lot of us would guess that the likelihood of success is more racially unequal for those growing up in the rural, midwestern community. Is this true, or do the data contradict cultural narratives for rural and urban areas? In this article, I analyze the success gap between Black and white individuals, not only how it varies by region and ruralness of the childhood community, but also how the relationship between the success gap and ruralness varies by region. The latter will help us understand if rural places are more equal than their urban counterparts in one region, but less equal than urban areas in another.
To capture the disparity between Black and white economic outcomes, I use Opportunity Atlas[ii] county-level data on the probability that a child born in the early 1980s found economic success by mid-30’s; economic success is defined as having a household income in the top 20 percent nationally for people their age. I calculated the county-level ratio of the probability for Black children to the probability for white children; let’s call this measure the Black-white success ratio. Intuitively, it is simply a ratio of the likelihood of economic success for Black to white individuals who grew up in the same county. A value of one indicates that Black and white individuals born in the given county in the early 1980s were equally likely to have found economic success in their mid-30s. In contrast, a value below one indicates that white individuals were more likely to find economic success.
I use the U.S. Census region definitions[iii] to divide the country into four areas: West, Midwest, South and Northeast. To capture the ruralness of the childhood community, I use county-level data from the 1990 U.S. Census[iv] on the share of the population living in rural areas;[v] these data reflect the ruralness of each county when the individuals we are analyzing would have been around ten years old.[vi]
I structure my statistical analysis of the data to relate the Black-white success ratio in each county to the county’s geographic region and rural population share,[vii] and to see how the impact of the rural population share on the success ratio varies by region. The results of my analysis are visualized below. In the visualization, each region has three bars representing the analysis-based prediction for a 100-percent rural county, a county with the regional average level of ruralness,[viii] and a 100-percent urban county.[ix]
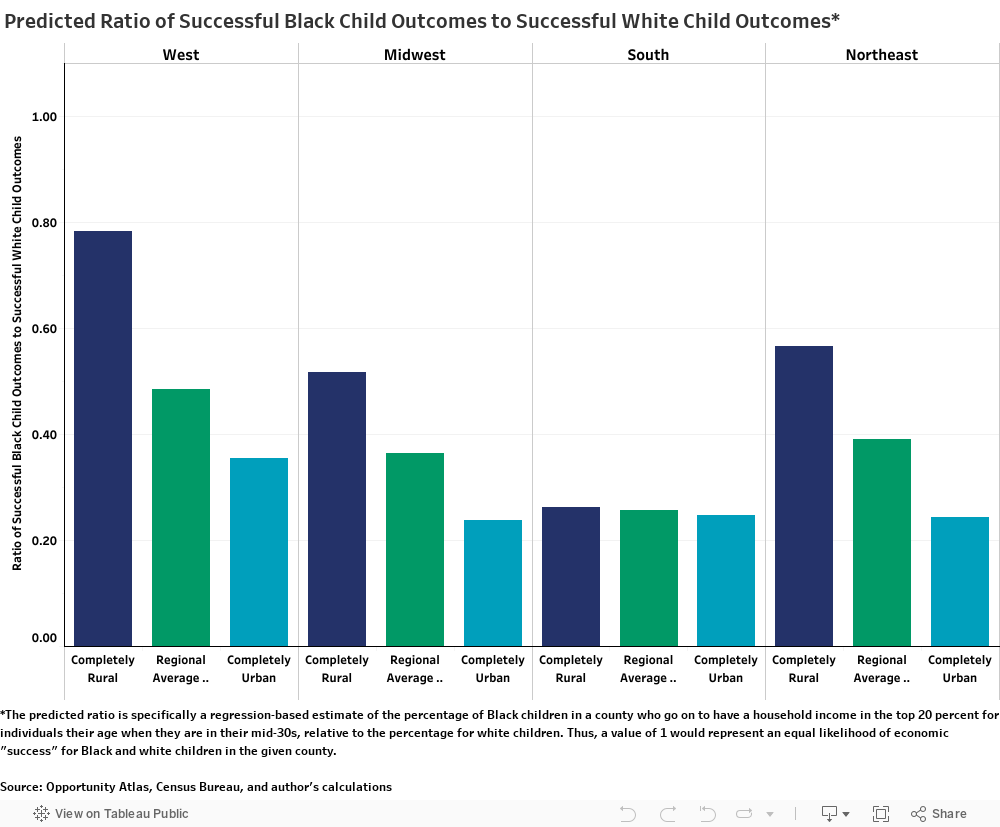
The results indicate significant differences in the success ratio across regions. Except for the South, rural areas have more equal (closer to one) ratios than urban areas. However, even in the most equal areas, completely rural western counties, Black individuals were only 78 percent as likely as white individuals to find economic success.
Looking more closely at specific regions, the West has the most equal ratios across all three ruralness levels, while the South is at, or near, the bottom for all three ruralness levels. The Midwest and Northeast have very similar ratios for each ruralness level, which may come as a surprise, given perceptions of each.
Going back to the question at the beginning of this article, is the ratio more equal (closer to one) in rural midwestern communities or northeastern cities? The data indicate that the rural midwestern community has the more equal ratio. In fact, rural midwestern communities outperform every region’s completely urban areas; the predicted success ratio for a completely rural midwestern county is 0.52, while the most equal predicted success ratio for a completely urban county is 0.35.
An antagonist might argue that rural areas and the Midwest have better ratios because urban areas, particularly on the coasts, afford an extremely high likelihood of success for white individuals, which would lead to a worse success ratio if the success rate for Black individuals is not similarly elevated. However, I tested this hypothesis in a separate analysis by considering how high shares of white individuals who are economically successful impact the Black-white success ratio and my predictions. I found that predictions that consider this impact are very similar to those presented in this article.[x] Thus, it is not simply the case that the results are driven by some counties having similarly poor success rates for Black and white individuals and other counties having excellent success rates for white individuals alongside middling success rates for Black individuals.
Beyond the concerns of my antagonist, the results lead to two questions:
- Why do rural areas tend to produce more equal outcomes than urban areas?
- Why do rural areas in the South not produce more equal outcomes than urban areas in the South?
While this article will not provide a definitive answer to either question, it is worth pondering possible explanations. For the first question, one notable possibility is the difference in school zoning and districting between urban and rural areas. There has been significant research on the drivers of attendance zone (the geographic zones that dictate which specific schools students attend) and school district (groups of schools overseen by a single governing and managing body) segregation in urban and suburban areas.[xi] One key component is that (sub)urban school attendance zones and even some (sub)urban school districts are geographically small – there are more than 500 public high schools in New York City[xii] – making it very easy for families to move from one school and/or district to another without significant disruption to lifestyle. Over time, this has resulted in wealthy, often white families moving to better school zones, driving up housing costs in those areas, and pricing low-income, often minority families out of the zones.
Another key component is the Supreme Court’s ruling in the 1974 Milliken v. Bradley case, which allowed local authorities to divide communities into segregated school districts so long as the explicit reason for the divisions was not racial segregation. This has permitted suburban and high-cost urban communities to maintain predominately white school districts by redrawing or creating new districts. Further, because in-district tax revenue provides a large share of public school funding across the nation, these high-income, majority-white school districts are able to provide more funding per student than neighboring minority-majority school districts.[xiii]
In rural areas, the situation is different. School districts may have only one high school/attendance zone and can be very large – sometimes entire counties. This limits the ability to price low-income families out of zones and/or districts and to create new, segregated districts that would contain a large enough student base to be financially viable from the perspective of the policymaker. Thus, at least in the public school system, education quality is naturally more equal in rural areas.
So what is different about the South? The answer may be the proliferation of private schools during the national desegregation movement. Analysis from the Southern Education Foundation shows that the South has outpaced the rest of the nation in private school enrollment growth since the 1940s. In fact, the rest of the nation has seen private school enrollment decline by about 30 percent since 1965, while enrollment in the South has continued to increase.[xiv] In the absence of small, segregated public school attendance zones and districts, private schools allow wealthy, white families in rural areas to create “segregation academies” with minority-blocking financial and acceptance barriers. In the face of federal desegregation efforts during the 1960s and 1970s, southern white families expanded “segregation academies” to a degree beyond the rest of the U.S., and many of these schools continue to segregate the southern education system.[xv] [xvi]
While schools and school zoning/districting likely explain a significant amount of the geography-driven variations we see in the visualization above, they certainly don’t tell the whole story. Future work by Heartland Forward and others will dive into the numerous drivers of unequal economic success. In the meantime, I ask that the reader keeps in mind the evidence I’ve provided about the differences between cultural narratives of rural America and reality. Rural America has its flaws, but, outside of the South, it is not the den of racial inequality it is often perceived to be. With regard to equality in economic success, the oft-lauded coastal cities could learn a thing or two from rural communities in the West, Midwest, and Northeast.
[i] One of the most notable examples: https://academic.oup.com/qje/article/135/2/711/5687353
[ii] https://www.opportunityatlas.org/
[iii] https://www2.census.gov/geo/pdfs/maps-data/maps/reference/us_regdiv.pdf
[iv] https://www2.census.gov/library/publications/decennial/1990/cp-1/cp-1-1.pdf
[v] The 1990 Census defined a rural inhabitant as anyone not living in an organized community of 2,500 people or larger.
[vi] I compared rural population shares across different Censuses and found the shares to be highly correlated. I also confirmed that the choice of Census has minimal impact on the finding presented in the visualization below. I chose the 1990 Census shares because they explicitly capture the ruralness of an individual’s childhood county during the individual’s childhood.
[vii] I specifically employ regression analysis to generate the results. Regression results are available upon request.
[viii] As there are several counties with too small of a Black population to calculate a Black-white success ratio, each region’s average level of ruralness is based on the counties for which I could calculate the success ratio, and, thus, could be used in the statistical analysis. The county-level average ruralness was 30.3 percent in the West, 45.1 percent in the Midwest, 59.8 percent in the South, and 45.2 percent in the Northeast.
[ix] Each region had completely urban and completely rural counties that were able to be used in the analysis, so none of the predictions are beyond the bounds of the data.
[x] For those interested in the more technical details of this hypothesis test, I specifically added to the regression model the county-level share of white children who went on to be economically successful. Thus, I explicitly controlled for the white-individual success rate in the model to see if that changed predictions for regions and rural and urban areas.
[xi] This article gives an excellent overview of researchers’ findings: https://equitablegrowth.org/research-paper/u-s-school-segregation-in-the-21st-century/?longform=true
[xii] https://www.usnews.com/education/best-high-schools/new-york/districts/new-york-city-public-schools-100001
[xiii] Many states have worked to close local tax-generated funding gaps between low- and high-income districts, but these efforts have been more recent and the allocation structures are not perfect. Additionally, increased spending, in the absence of other efforts, does not necessarily lead to higher academic performance.
[xiv] https://www.southerneducation.org/publications/historyofprivateschools/
[xv] https://files.eric.ed.gov/fulltext/ED596492.pdf
[xvi] https://www.theatlantic.com/national/archive/2012/12/in-southern-towns-segregation-academies-are-still-going-strong/266207/