Note to reader: Over the next several weeks, Heartland Forward will be analyzing the types of businesses and races of business owners that received PPP loans through June 30, 2020.
It is worth noting at the outset that an overwhelming majority of applications did not identify race, ethnicity or gender. Given the limited number of responses, we aggregate and report the data at the state level.
You can preview the visualizations referenced below here:
(For mobile viewers, we recommend landscape orientation.)
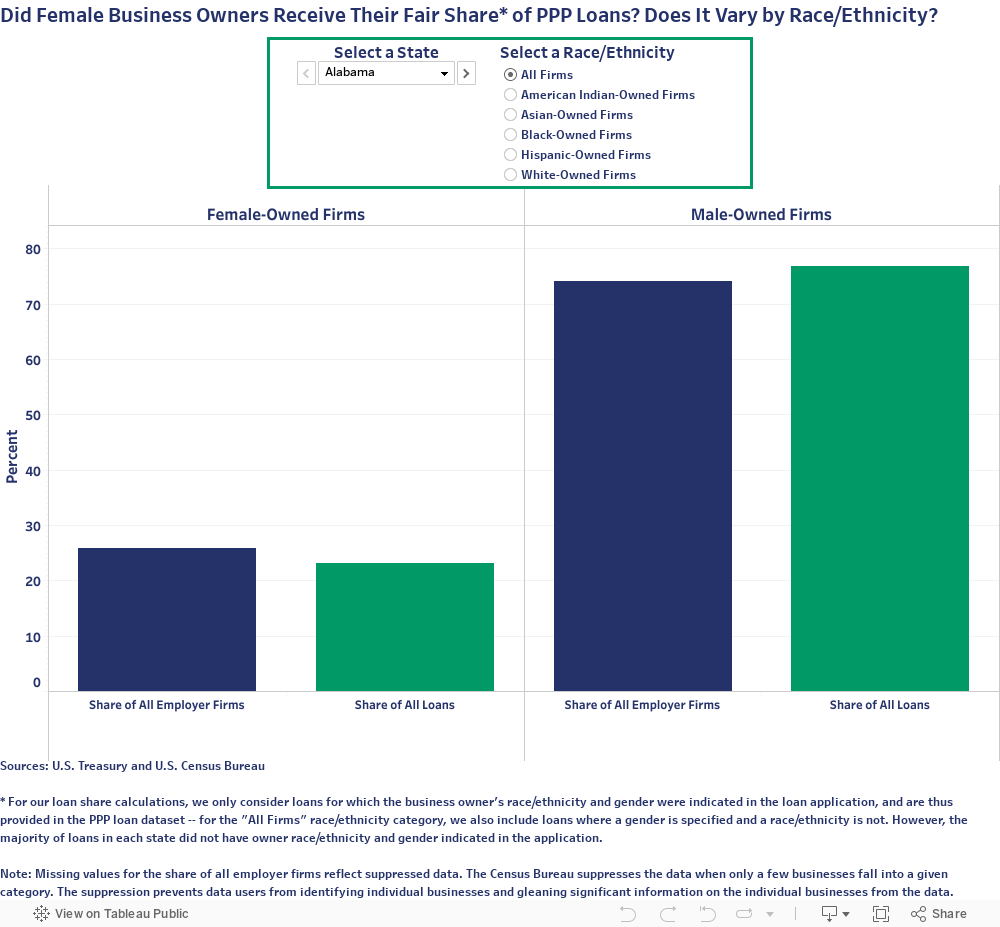
Exploring the Share of Loans by Gender and Race/Ethnicity chart, one can quickly observe that men dominate business ownership and male-owned businesses received nearly three-times as many loans as female-owned businesses in every state in the Heartland. (NOTE: You can view any state in the Heartland1 by selecting it from the drop-down menu.) Across all 20 states, female-owned firms represent only between 20 and 30 percent of employer firms and a similar percentage of PPP loans. In all Heartland states, male-owned firms (across all races and ethnicity) received a greater share of PPP loans than their share of employer firms.
The number of minority-owned businesses vary in each state, so we compare the share of PPP loans to female- and male-owned businesses by race to the share of all employer firms that are male- or female-owned (probably the closest number to the population of businesses applying for PPP).
The first column in each side of the chart represents the benchmark values: share of employer firms. The second column presents the share of loans going to either female- or male-owned businesses. If this right-most column is higher than those to the left, then this indicates that the minority group received a greater share of loans than one would expect based on the group’s share of firms.
Several observations:
• Hispanic-owned businesses owned by males and females received a greater share of loans than expected in every state except Illinois.2 This is consistent with our previous findings for Hispanic business owners overall.
• Female American Indian-owned businesses received a greater share of PPP loans than expected in 9 states: Alabama, Indiana, Kentucky, Michigan, Missouri, Ohio, South Dakota, Texas and Wisconsin.2
• In only 2 states, Indiana and South Dakota, did Asian female-owned businesses receive their fair share of PPP loans.
• Nine states realized a greater share of PPP loans among Black female-owned businesses than the corresponding employer firms share.2
• Only in Mississippi did white female-owned businesses receive more PPP loans than would be expected based upon all employer firms.
• In contrast, male-owned businesses for 3 or more of the race and ethnicity categories in 13 states received a greater share of PPP loans than the expected share based upon employer firms.
Payroll Protection Program (PPP) represents a unique stimulus program designed to encourage businesses to maintain payroll levels despite pandemic-related interruptions by authorizing local financial institutions to extend potentially forgivable loans at favorable terms. The program provided one-percent loans to qualifying businesses, though the loan would be forgiven if certain requirements were met by the business.3
While designed for expediency, the PPP sought to leverage existing financial institutions to distribute the loans rather than create tedious qualification rules and bureaucracy, which would have required both time and resources. However, expediency is not without cost – specifically, leveraging existing financial institutions may limit access to the PPP for minority business owners.
Minorities are grossly un- or underbanked. Consider these statistics from the FDIC4:
• 17 percent of white households nationally are unbanked or underbanked.
• 20 percent of Asian households nationally are classified as either unbanked or underbanked.
• 43 percent of Hispanic households nationally are under- or un-banked.
• 45 percent of American Indian households are considered under- or un-banked.
• 47 percent of Black households nationally are considered under- or un-banked.
• Without prior relationships with a banking institution, minority business owners may not have had adequate access to PPP funding.
So, what does this all mean? In short, it means that the Heartland’s female-owned firms did not receive their fair share of loans across the Heartland. When race is considered, Hispanic female-owned firms did receive their fair share in all but one state; for other races, however, minority female-owned businesses did not receive a proportionate amount of loans in most states. While entrepreneurship is not the single driver of our economy, it is an important one as noted in Heartland Forward’s previous report, “Young Firms and Regional Economic Growth.”5 Knowing this, we need to work collectively to remove the inequality of economic opportunity to help people sustain their businesses especially during such unprecedented times.
Congress and the Trump administration need to reach an agreement on extending economic and financial aid to those firms and individuals most impacted by COVID-19. Another round of PPP loans should be a major piece of the legislation as entrepreneurs are the main source of job creation across the Heartland. In order to foster equity, inclusion and job creation, subsequent PPP loans must be structured in a manner that under- and un-banked female minority entrepreneurs have representative access to these funds. The Heartland cannot afford to lose as single job that could be created by a female entrepreneur of color.
Below is the schedule of posts in this series:
• Week 1: Black and Hispanic Business Owners
• Week 2: American Indian, Pacific Islander and Asian owned businesses
• Week 3: Loan Recipients by Gender
• Week 4: Accommodations and Food Services & Arts, Entertainment, Recreation Businesses
• Week 5: Manufacturing
• Week 6: Retail & Other Services
Data Notes
Data on Payroll Protection Program3 loans are from the U.S. Treasury. These are loan-level data based on individual loan applications. We aggregated loan-level data to the state level in order to capture the state-level distribution of loans across races and ethnicities.
Data on owners of employer firms are from the U.S. Census Bureau’s 2017 Annual Business Survey.
In the Payroll Protection Program loan data, there is a single characteristic variable combining business owner race and ethnicity instead of separate race and ethnicity variables. Thus, owners are classified by the single race or ethnicity that they believe best describes them, as opposed to being able to indicate, for example, that they are both Hispanic and Black. Applicants were given the option to select “Multi-Group” in their application, but the Heartland only had one approved loan where the applicant selected the option. Meanwhile, the Census Bureau’s survey data allowed respondents to choose both a race and an ethnicity. To overcome this incompatibility, we consider any respondents who selected Hispanic for their ethnicity to be Hispanic only, respondents who selected non-Hispanic for ethnicity and Black for race to be Black, and respondents who selected non-Hispanic for ethnicity and white for race to be white.
Additionally, Payroll Protection Program loan applications asked applicants whether their business is male-owned or female-owned, while the corresponding Census survey question allowed respondents to choose among male-owned, female-owned, and equally male- and female-owned. To resolve this inconsistency, we attribute half of the male- and female-owned businesses to female-owned businesses, and we attribute the other half to male-owned businesses. In doing this, we are assuming that equally male- and female-owned businesses that applied for PPP loans randomly selected male-owned or female-owned in the application.
ENDNOTES
- The Heartland region consists of these states: Alabama, Arkansas, Illinois, Indiana, Iowa, Kansas, Kentucky, Louisiana, Michigan, Minnesota, Mississippi, Missouri, Nebraska, North Dakota, Ohio, Oklahoma, South Dakota, Tennessee, Texas and Wisconsin.
- Firm owner data by gender are unavailable for Black and Hispanic business owners in North Dakota and South Dakota, and for American Indian business owners in Illinois.
- Complete details about the SBA’s Payroll Protection Program, including qualifying businesses and loan forgiveness criteria, can be found here: https://www.sba.gov/funding-programs/loans/coronavirus-relief-options/paycheck-protection-program.
- Calculations made by the author using Federal Deposit Insurance Corporation’s 2017 National Survey of Unbanked and Underbanked Households. Available at https://www.economicinclusion.gov. Unbanked households have no accounts at an insured financial institution, while underbanked households have a savings or checking account but solicit alternative financial services (e.g., check-cashing firm or payday lender) for other transactions.
- Crews, J., DeVol, R., Florida, R., and Shideler, D. (May, 2020). “Young Firms and Regional Economic Growth: Knowledge-Intensive Entrepreneurs Critical.” Bentonville, AR: Heartland Forward. Available here: https://heartlandforward.org/media/pages/young-firms-and-regional-economic-growth/2863128872-1588779952/young-firms_full-report-launch.pdf