

In these turbulent times where labor markets are adjusting to remote work, people are re-evaluating their willingness to engage in daily interactions given new risks, and firms in all states and industries struggle to fill positions, the self-employed segment of the labor force may provide some important clues as to how to best think about human capital and the brain power needed to move the heartland, and the rest of the economy, forward.
This is the first of three short blogs discussing self-employment and looking at the U.S. self-employment data.
The first post, below, discusses self-employment in general and compares the rates in metro and non-metro areas of the heartland and non-heartland states. The second post looks at self-employment rates in specific industries where self-employment options have expanded due to apps and new market models. The third post looks exclusively at the heartland states and looks at the relationship between self-employment rates and the percentage of employer jobs that qualify as opportunity occupations.
Propensity for Self-Employment
A middle-class income is possible without a four-year degree. In the Heartland of Opportunity report, Joel Kotkin and I discuss the importance of middle-income occupations that do not require four-year college degrees and describe current availability of those employment opportunities in the Heartland.¹ The report is based on job opportunities as an employee, but working for an employer is not the only, and frequently not even the preferred way, to generate income. For many, the American Dream involves being your own boss and directing your own financial destiny by owning a business or being self-employed.
The perks of being self-employed, such as controlling at what times and how often you work and which projects you accept, give control to the person performing the work and may be a sign of highly empowered or flexible labor force. While working as a contractor may come with more control, it also comes with more risk and is not an ideal solution for everyone. The work arrangements between firm and contractor are less regulated than the employer-employee relationship. Some firms have expanded their utilization of contractors, creating the “gig economy” for a wider range of occupations. The gig economy has also been bolstered by apps such as Lyft, Instacart, and Jobble and web-based market models such as Airbnb, Etsy, and Upwork that make it easier to match buyers and sellers in local or worldwide markets for goods and services. This makes self-employment or gig work viable and more profitable to free-lancers who would have little time or expertise to invest in prospecting for clients or marketing. For some, self-employment represents a welcome low commitment, highly flexible option for generating additional income to supplement their current job until they are better established in their desired profession or as their primary source of income. With schools and daycares closed during the COVID pandemic, the flexibility has been a vital benefit for many working parents. For others it may be an unwelcome reality of the current economy where they have fewer traditional employment options. Regardless of the motivations driving the transition, self-employment has become an important aspect of modern labor markets that should be incorporated for a full understanding of the regional opportunities available to workers. This is the first of three blog posts looking at patterns in self-employment in the U.S.
In this post I compare the propensity to be self-employed² in the metro and rural³ regions of all fifty U.S. states. Wide disparities in propensity for self-employment could signal differences in opportunities that do not show up in the jobs data when looking exclusively at employment. I use non-employer firms data from the U.S. Census Bureau as a measure of self-employment. Firms are included in this dataset if they have at least $1,000 in revenue, are subject to federal income taxes, and have no non-owner employees, although firms may be organized as a sole-proprietor, partnership, or small corporation. Examples of non-employer firms are artisans selling handmade goods online, delivery service shoppers, real estate agents, professional freelancers in many fields, home-share property owners, and ride-share drivers. Nationwide, 36 percent of people in the labor force have participated in the gig economy, and 41 percent of college graduates have done some freelance work.
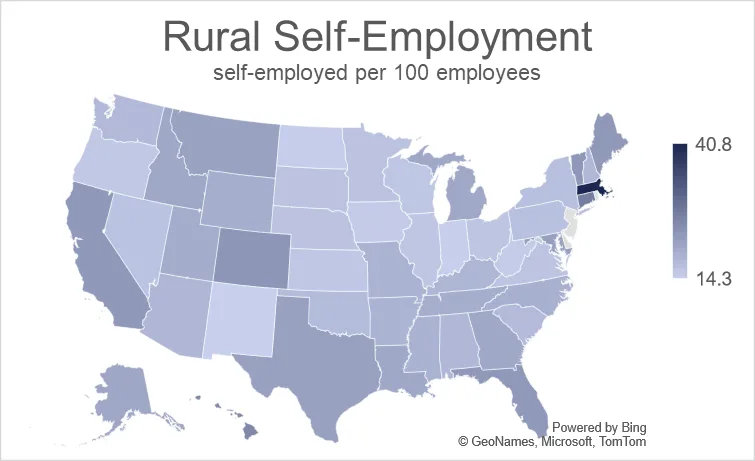
For the 2018 data used in this analysis, there are roughly 17 self-employed people for every 100 employees nationwide, however the propensity for self-employment varies from just over 8 in Washington, D.C. to over 40 self-employed folks per 100 employees in rural Massachusetts.
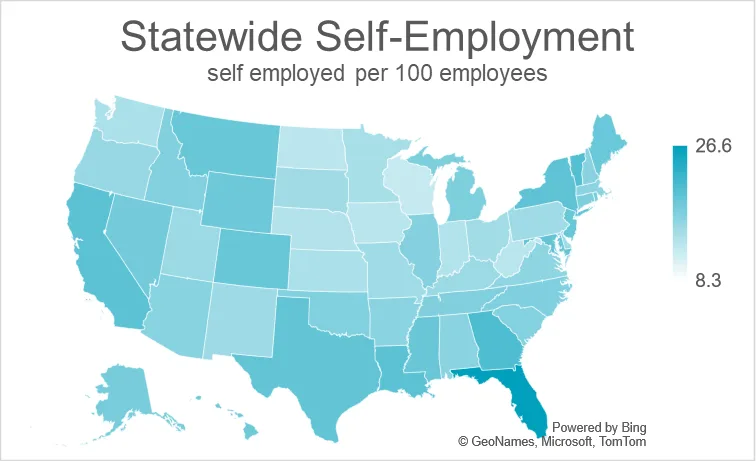
If you notice the scales on the maps above you see that overall, the rural self-employment numbers are higher. And on both maps, the Heartland has more states that are the lighter shades. I look at the propensity for self-employment across geographies and test to see if there are significant differences in metro and rural areas and in the Heartland versus the rest of the country.
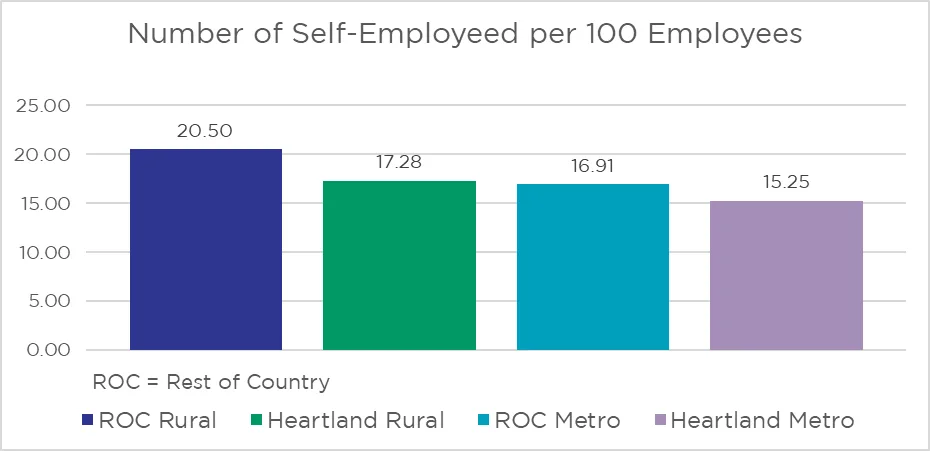
There is a clear pattern of regional variation in the propensity for self-employment. Rural areas do have higher rates of self-employment than metros and the heartland states have lower rates of self-employment than the rest of the country as seen in the graph above. These differences reflect actual differences in self-employment rates.⁴
There are dozens of contributing factors or possible explanations for these observed differences in self-employment propensity. It could be a difference in the industrial and occupational mix of the local economy, differences in the availability of other employment alternatives, or differences in access to the tools and skills needed for self-employment. Future blog posts will explore how self-employment propensity varies by industry and regional labor markets in the U.S.
This is the first of three short blogs discussing self-employment and looking at the U.S. self- employment data. The second post looks at self-employment rates in specific industries where self-employment options have expanded due to apps and new market models. The third post looks exclusively at the heartland states and looks at the relationship between self-employment rates and the percentage of employer jobs that qualify as opportunity occupations.
Endnotes
1) The Heartland Region consists of Alabama, Arkansas, Illinois, Indiana, Iowa, Kansas, Kentucky, Louisiana, Michigan, Minnesota, Mississippi, Missouri, Nebraska, North Dakota, Ohio, Oklahoma, South Dakota, Tennessee, Texas, and Wisconsin.
2) The number of non-employer firms are used as a proxy for self-employment.
3) Urban regions are all counties in a state that belong to a Metropolitan Statistical Area (MSA) as defined by the Office of Management and Budget. The rural region of a state includes all counties not in an MSA.
4) Details of statistical tests available upon request.