

In these turbulent times where labor markets are adjusting to remote work, people are re-evaluating their willingness to engage in daily interactions given new risks, and firms in all states and industries struggle to fill positions, the self-employed segment of the labor force may provide some important clues as to how to best think about human capital and the brain power needed to move the heartland, and the rest of the economy, forward.
This is the second of three posts looking at the geographic variation in self-employment in the U.S.
The first post discussed self-employment in general and compares the rates in metro and non-metro areas of the heartland and non-heartland states. The second post, below, looks at self-employment rates in specific industries where self-employment options have expanded due to apps and new market models. The third post looks exclusively at the heartland states and looks at the relationship between self-employment rates and the percentage of employer jobs that qualify as opportunity occupations.
Industry Specific Self-Employment
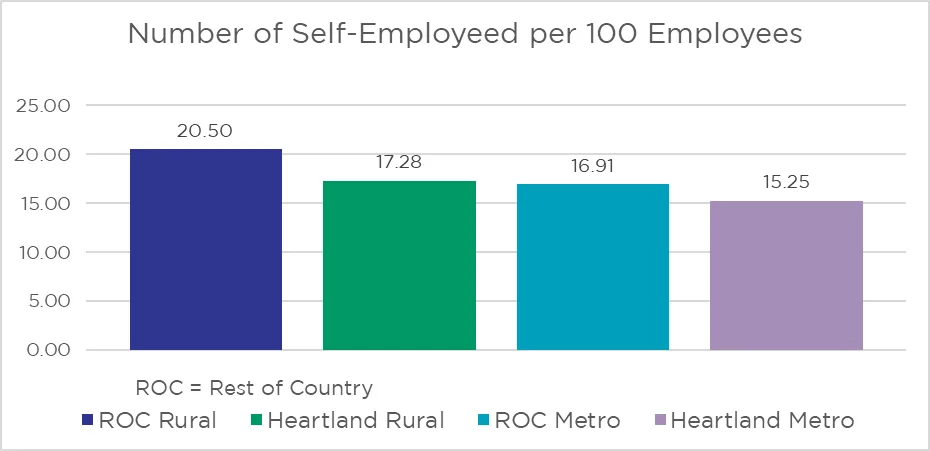
My previous blog looked at the overall rate of self-employment in the metro¹ and rural regions of the states and found some significant differences in the propensity to be self-employed. Metro areas and heartland² states had lower propensities for self-employment when measured as the number of self-employed³ per 100 employees.
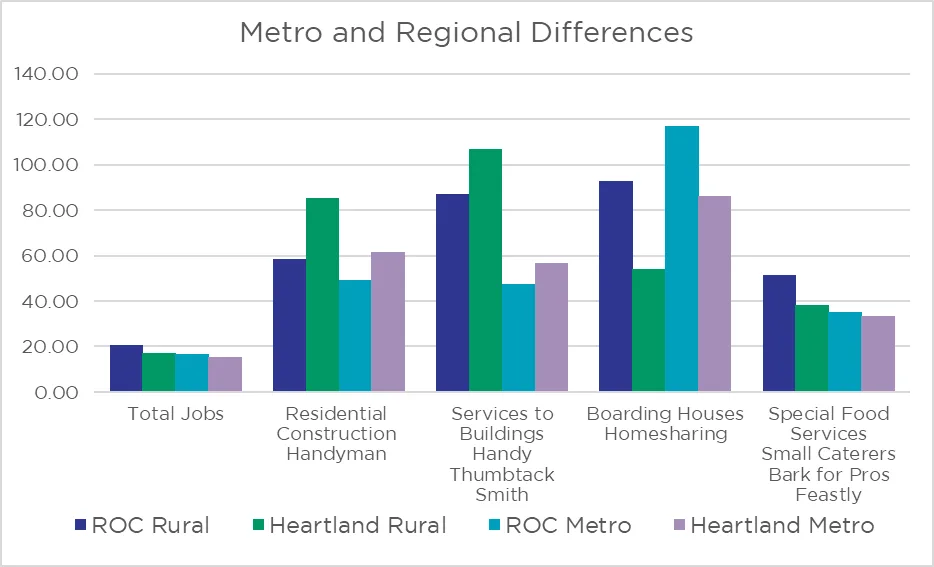
Here I consider some industry specific⁴ rates of self-employment to see if they vary across the U.S. The industries chosen are the broad industry groups that encompass some of the more popular “gig economy” fields. The names of some popular apps⁵ or services that facilitate self-employment are listed below the industry labels. Like total employment, the self-employment rates in residential construction, building services, boarding houses, and special food services vary across metro and rural areas and in the heartland relative to the rest of the county. Only in special food services does the pattern match total employment with heartland and metro areas having lower self-employment rates. For residential construction and building services, self-employment is more frequent in heartland and rural regions. For boarding houses we see higher rates of self-employment relative to number of employees outside the heartland and in metro areas.
There are six industries where differences between metro and rural areas are obvious, but the heartland does not appear to have a self-employment propensity that differs from the rest of the county.
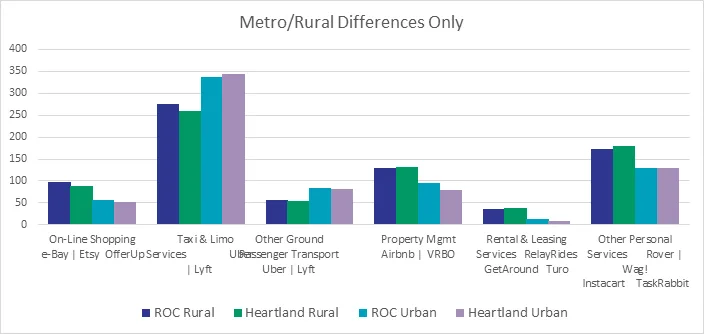
Once again, the direction of the difference varies with the labor market. In online shopping, property management, rentals and leasing services, and other personal services we see a higher propensity for self-employment in the rural areas. In the taxi and limo services, and other passenger transport, we see a higher propensity for self-employment in the metro areas.
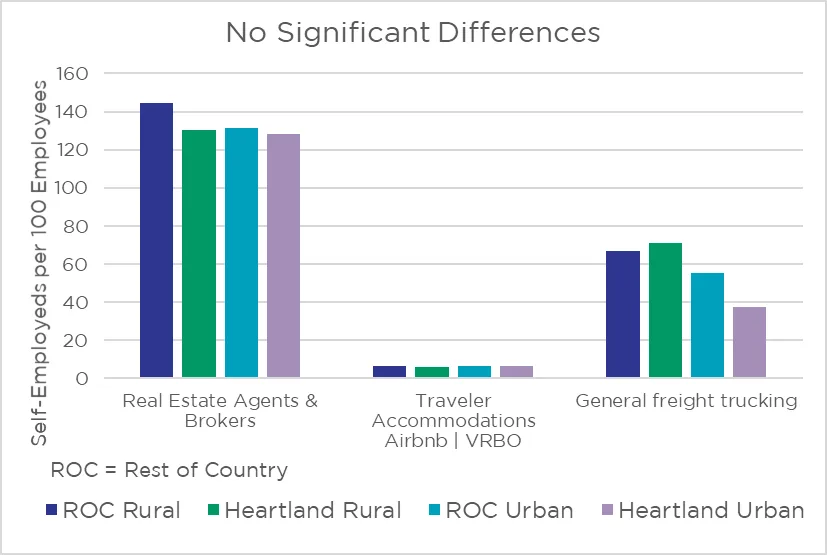
There are three industries where there are no substantive differences between any of the regions of the country: General freight trucking, real estate agents, and travel accommodations. Interestingly, this is true for real estate agents, with very high rates of self-employment everywhere, travel accommodations which has very low rates of self-employment everywhere, and general freight trucking which is about half-way in between.
The observed differences in overall self-employment seem to be driven by patterns in some industries. Not only are there regional differences in the propensity to be self-employed, but it seems the type of work self-employed people do may vary as well. Special food service workers are more likely to be self-employed in rural areas, but taxi drivers are more likely to be self-employed in metro areas and residential builders are more likely to be self-employed in the heartland.
As with so much of the economic and labor market data available to us, the deeper you look, the more interesting and nuanced the story becomes. Labor markets are clearly not the same for all occupations or in all areas. My next blog post will look at how self-employment rates vary across the heartland regions compared to opportunity occupation availability.
This is the second of three short blogs discussing self-employment and looking at the U.S. self- employment data. The first post discusses self-employment in general and compares the rates in metro and non-metro areas of the heartland and non-heartland states. The third post looks exclusively at the heartland states and looks at the relationship between self-employment rates and the percentage of employer jobs that qualify as opportunity occupations.
Endnotes
1) Metro regions are all counties in a state that belong to a Metropolitan Statistical Area (MSA) as defined by the Office of Management and Budget. The rural region of a state includes all counties not in an MSA.
2) The Heartland Region consists of Alabama, Arkansas, Illinois, Indiana, Iowa, Kansas, Kentucky, Louisiana, Michigan, Minnesota, Mississippi, Missouri, Nebraska, North Dakota, Ohio, Oklahoma, South Dakota, Tennessee, Texas, and Wisconsin.
3) The number of non-employer firms are used as a proxy for self-employment.
4) The industries are four-digit NAICS codes for some popular gig-work options.
5) Some apps show up in more than one industry NAICS code since there is not universal agreement on which code best captures it.