

In these turbulent times where labor markets are adjusting to remote work, people are re-evaluating their willingness to engage in daily interactions given new risks, and firms in all states and industries struggle to fill positions, the self-employed segment of the labor force may provide some important clues as to how to best think about human capital and the brain power needed to move the heartland, and the rest of the economy, forward.
This is the third of three posts looking at the geographic variation in self-employment in the U.S.
The first post discusses self-employment in general and compares the rates in metro and non-metro areas of the heartland and non-heartland states. The second post looks at self-employment rates in specific industries where self-employment options have expanded due to apps and new market models. The third post, below, looks exclusively at the heartland states and looks at the relationship between self-employment rates and the percentage of employer jobs that qualify as opportunity occupations.
Self-Employment and Opportunity Occupations in the Heartland
In this post, I focus on the metro and rural regions¹ of the twenty heartland states² and consider opportunity occupation³ jobs and self-employment simultaneously. When looking at the measures of opportunity occupations and self-employment simultaneously, three distinct patterns are clear:
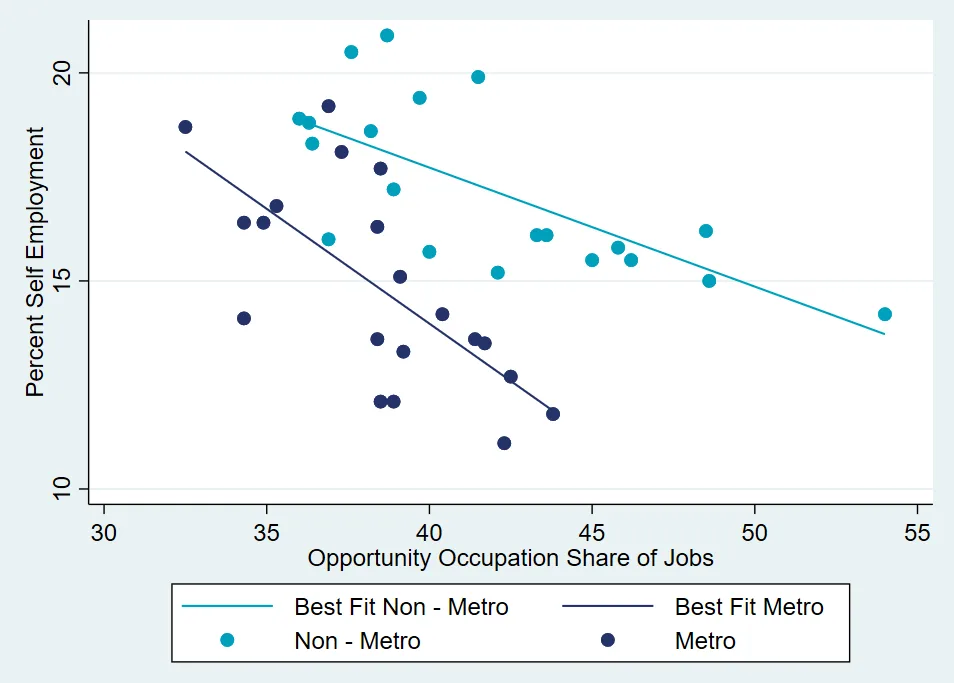
- On average, self-employment is higher in the non-metro regions of the heartland.
- There appears to be an inverse relationship between self-employment and opportunity occupations. Areas with a larger share of opportunity occupations have fewer self-employed, and vice versa.
- The relationship between opportunity occupation employment and self-employment differs between metro and non-metro regions of heartland states. As illustrated by the best-fit lines in the chart below, metro regions have a steeper slope than non-metro regions, suggesting a smaller change in opportunity occupations corresponds with a larger change in self-employment in the metro regions of the Heartland.
When fewer employees are earning middle-class wages without a four-year college degree the rate of self-employment is higher, but the data do not allow us to make any inference as to the causes or underlying mechanism that drives the relationship. It could be that in metro areas firms are larger and you see more auto mechanics and plumbers as employees, but in smaller areas they are self-employed with no employees. It could be that in metro markets there are more opportunities for side-hustles and the best-fit line is steeper as low wage workers take additional gigs on the side to make ends meet. There is an implicit tradeoff that may be influenced by the employment regulations of states or local labor markets: when firms use self-employed contractors, they hire fewer employees with opportunity wages and vice versa. Or it could be the result of people responding to incentives and creating their own job opportunities when the labor market does not offer enough suitable options.
The differences in self-employment and opportunity occupations between metro and rural regions cannot be explained with the data analyzed here, but the differences do raise interesting questions. Opportunities to dive deeper into the data and learn more about the mechanisms and differences in local labor markets should allow us to better understand what matters and what can be done to improve labor market outcomes.
There is a clear public interest in having more people earning middle-income wages, though not necessarily a preference for self-employment versus employed workers since different people prioritize different employment characteristics. Policy makers should carefully evaluate support for programs that promote both paths to stable incomes for workers and families in the heartland.
This is the third of three short blogs discussing self-employment and looking at the U.S. self- employment data. The first post discusses self-employment in general and compares the rates in metro and non-metro areas of the heartland and non-heartland states. The second post looks at self-employment rates in specific industries where self-employment options have expanded due to apps and new market models.
Endnotes
1) Metro regions are the counties designated as belonging to a metropolitan statistical area as defined by the U.S. Office of Management and Budget. Rural regions are all counties not designated as belonging to an MSA.
2) The Heartland is defined as the following states: Alabama, Arkansas, Illinois, Indiana, Iowa, Kansas, Kentucky, Louisiana, Michigan, Minnesota, Mississippi, Missouri, Nebraska, North Dakota, Ohio, Oklahoma, South Dakota, Tennessee, Texas, and Wisconsin.
3) Opportunity occupations are generally jobs which pay a middle-income wage but do not require a four-year college degree to pursue. For details on how they are determined, see the recent Heartland of Opportunity report.